StellarNet, Inc. is a Global provider of low cost compact spectrometers, systems, and software for product analysis, research, education, and OEM. StellarNet instrumentation is research grade and rugged for any environment – lab, process, or field.
Spectrometer Systems in Stock and Fast Shipping!
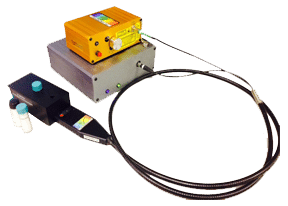
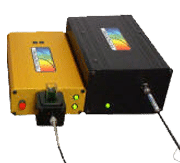
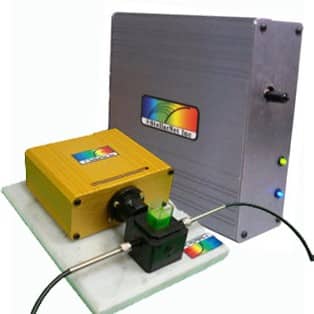
Compact Spectrometer Technologies
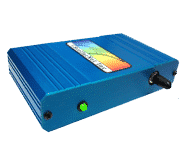
UV-VIS
190-1150nm
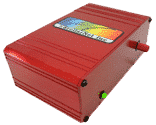
Near Infrared
900-2500nm
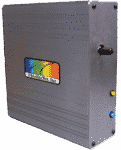
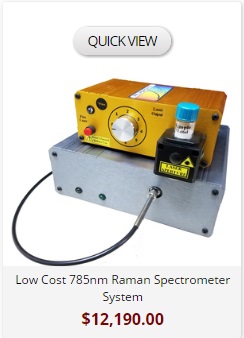
Raman
532, 785, 1064nm
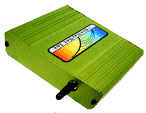
Educational
low cost / simple interface

StellarNet Releases New StellarElite™ High Performance Spectrometers
StellarNet is proud to offer StellarElite™, our new elite line of high performance spectrometer systems. StellarElite Systems offer up to 10x optical gain, ultra sensitive detectors, and options for auto-mapping microscopy! StellarElite offers high performance at an affordable price and are considered a tier above StellarNet’s famous BLUE-Wave and BLACK-Comet. New spectrometers in our elite line are the Quasar, HYPER-Nova, and Quasar-UltraCool.
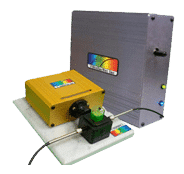
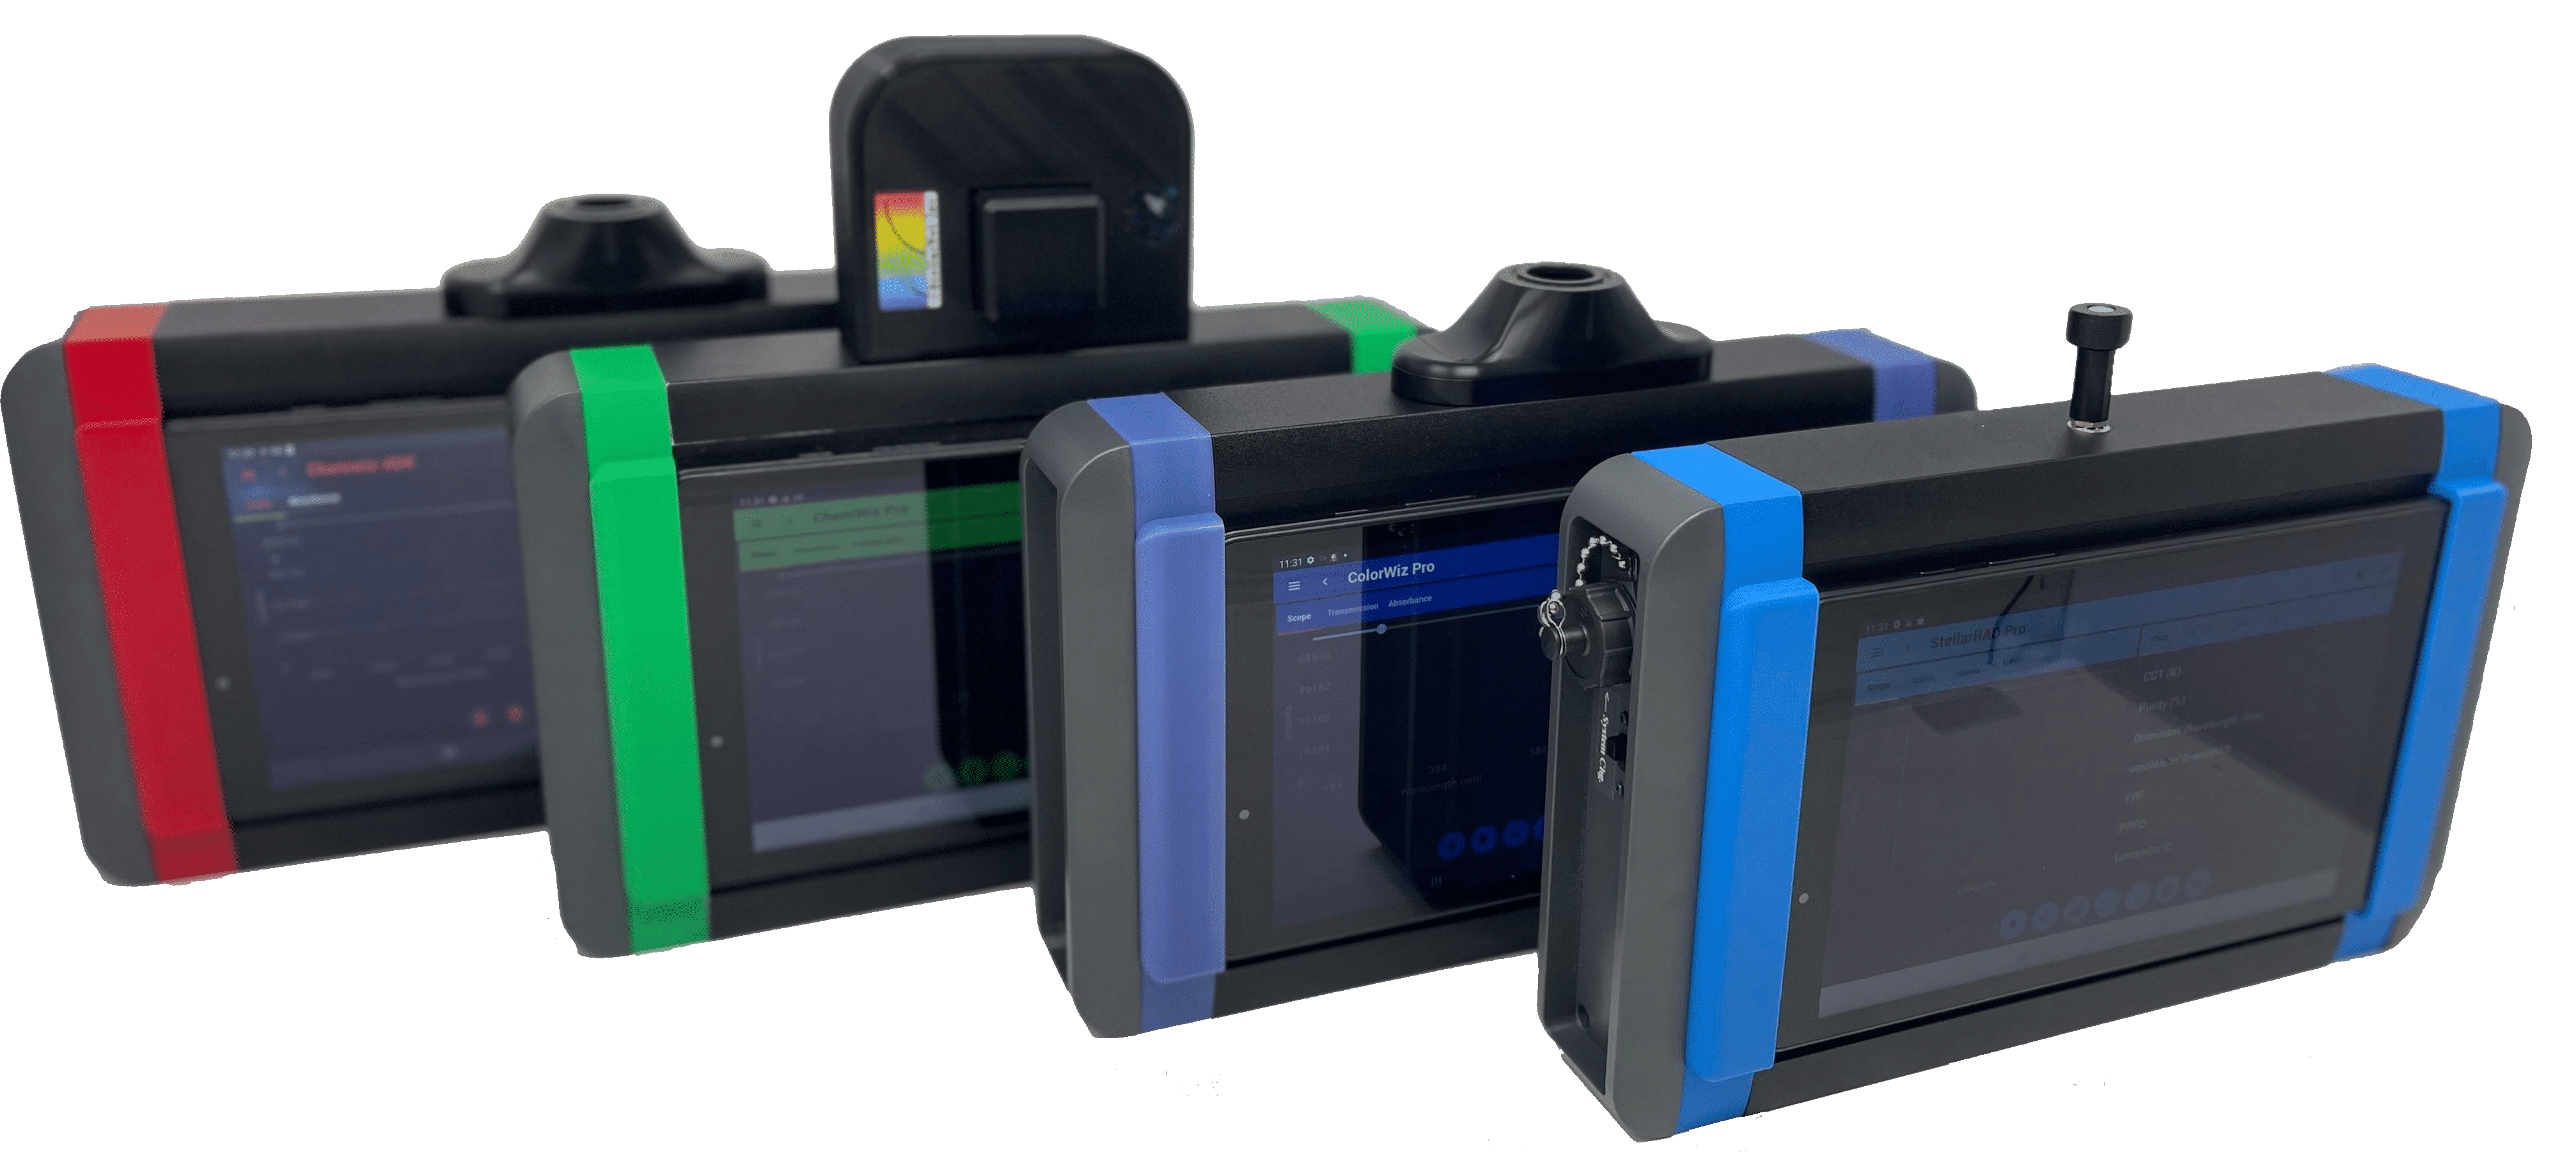
Modular Spectrometer Systems
SpectroChemistry
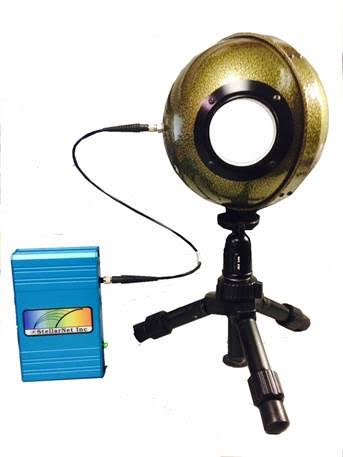
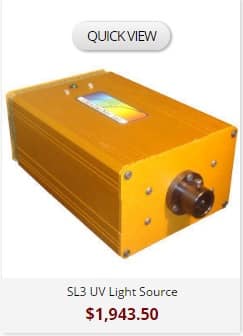
Light Measurement
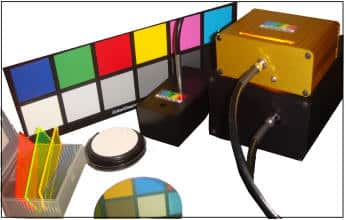
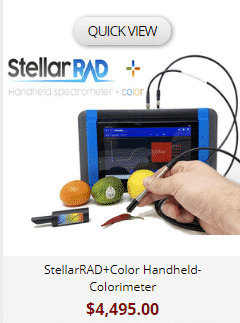
Color Measurement
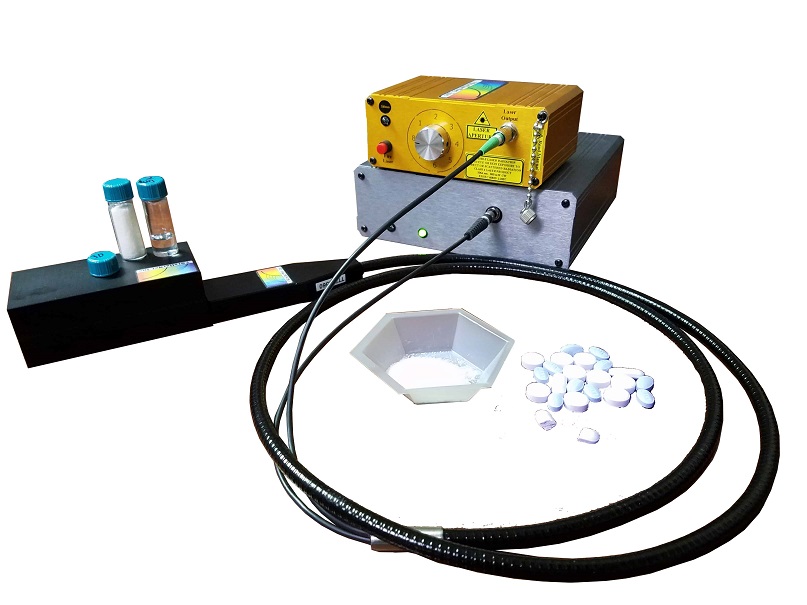
Raman Systems
Learn About Popular Light Measurement Applications

This Month’s Featured Analyzer
ChemWiz-ADK™ NIR Feed and Pet Food Analyzers
Handheld, Lab, and Process Instruments for %Fat, Moisture, Protein & Ash
StellarNet’s application division, Analyzers for Industry, provides a variety of rugged and portable analyzer systems that solve a wide range of analytical needs across many industries. Our analyzers are real-time rapid (several seconds per scan), easy to use, accurate, and reliable. Our analyzers integrate our own spectrometer OEM engines and use our years of technical and application experience to provide your company a competitive advantage in your industry.
STELLARNET NEWS
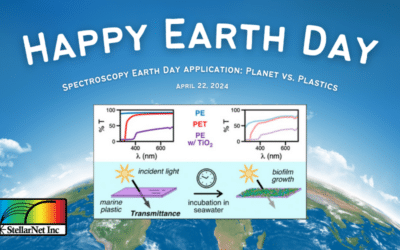
Earth Day 2024 with StellarNet: Planet vs. Plastics
Happy Earth Day! Today serves as a reminder of the importance of environmental conservation and sustainable practices to ensure the well-being of our planet for future generations. At StellarNet, we support sustainability and preserving Earth's precious ecosystems....
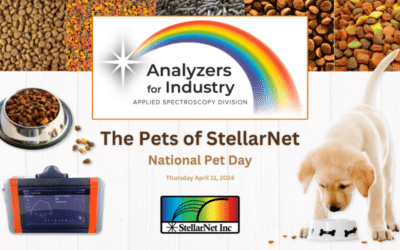
The Pets of StellarNet and the ChemWiz-ADK™ NIR Feed and Pet Food Analyzers
Today, April 11th, is National Pet Day! This month, we are highlighting our ChemWiz-ADK™ NIR Feed and Pet Food Analyzers. Our Pet Food Analyzer, consisting of combined hardware and software calibration packages, can help you improve consistency and quality of...
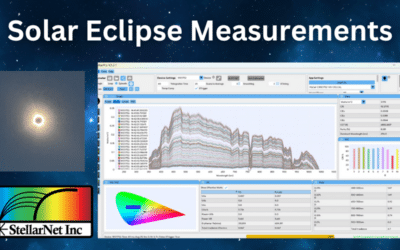
The 2024 Solar Eclipse with StellarNet
Witnessing Monday's total solar eclipse was an absolutely incredible experience! Where we are in Florida, we had about 60% blockage so it was only a partial solar eclipse, but there were still cool sightings and measurements taken. For a few hours, we were able to go...
StellarNet Online Shop 
Our online shop allows you to purchase instrumentation in seconds. Most items are available “In Stock” and we offer expedited deliveries. Not only are spectrometers, light sources, and accessories available, but in addition our Technical Sales team has preconfigured systems for Color Measurement, LED Characterization, Fluorescence Chemistry, Raman, LIBS and much more.